Using PowerTutor
PowerTutor allows user to monitor the real-time power consumption of the phone or monitor the power consumption of applications.
Overview of major features
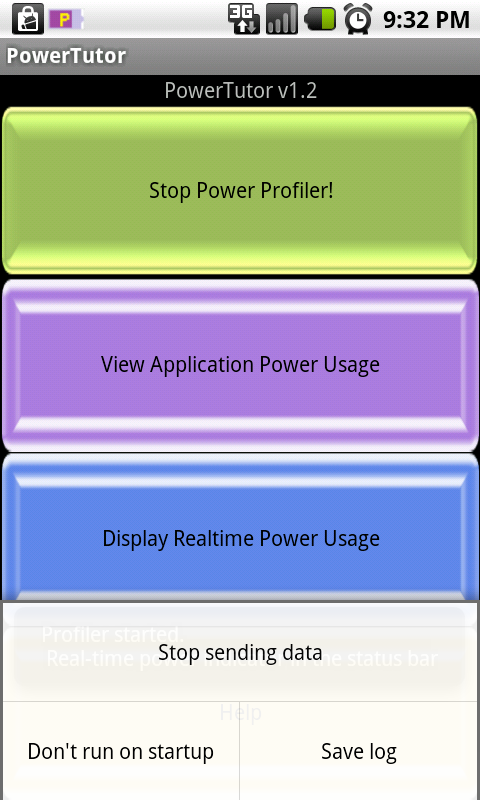
The main panel controls the major features of PowerTutor.
- Start/Stop the profiler: The profiling service has to be running to collect power statistics.
- View application power usage: This shows the application specific power/energy consumption.
- Display system power usage: This shows the whole system power/energy consumption decomposed by hardware components.
- Notification in status bar: Real-time total
system power consumption can be monitored using the
real-time indicator (![]() )
shown in the status bar.
)
shown in the status bar.
- Features from Menu:
Stop sending data: PowerTutor automatically sends power traces back to the PowerTutor research group. Pressing this button disables this feature.
Don't run on start up: PowerTutor automatically runs in the background when the phone is started. Pressing this button disables this feature.
Save log: Pressing this button saves the current power trace to /sdcard/PowerTrace.log in an easy-to-understand way. Users who are interested in detailed power profile can parse the file to get the data.
Display system power usage
Displays the total system power consumption decomposed by hardware components including: LCD/OLED, CPU, Wifi, 3G, GPS and Audio. The data can be checked in either Chart view or in Pie view.
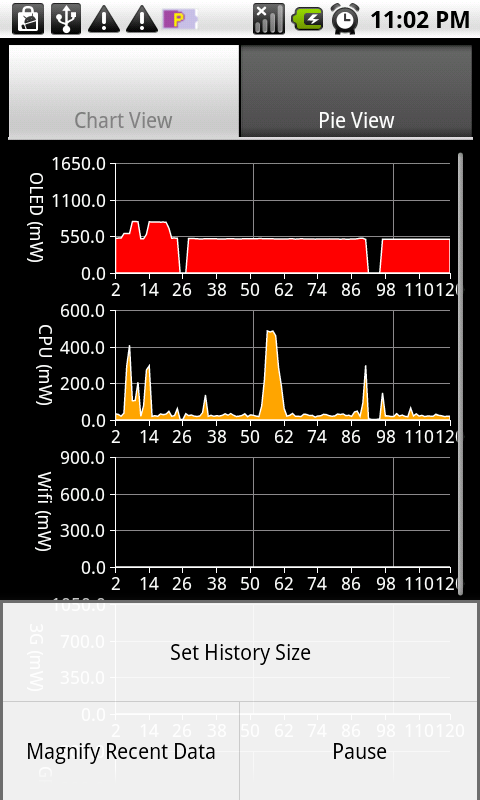
- Chart view:
The dynamically changing figure shows the power
consumption of the phone categorized by hardware device. This
view is intended to show the latest data up to 5 minutes in
great details.
The X-axis is time while Y-axis is the power consumption.
Features from Menu:
Set history size: Adjust the number of data points to display.
Magnify recent data: This options allows one to zoom in the most recent data.
Pause/Resume: Freeze/unfreeze the current display.
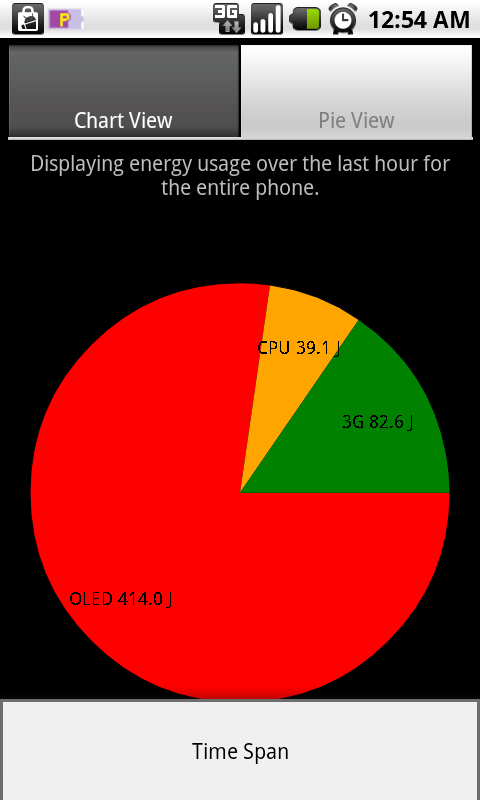
- Pie view:
The dynamically changing figure shows the power/energy consumption of the phone categorized by hardware device. This view is intended to show the aggregated data in long run.
Features from Menu:
Time span: Adjust the length of data that takes into aggregation. User could check out up to one day's power profile.
View application power usage:
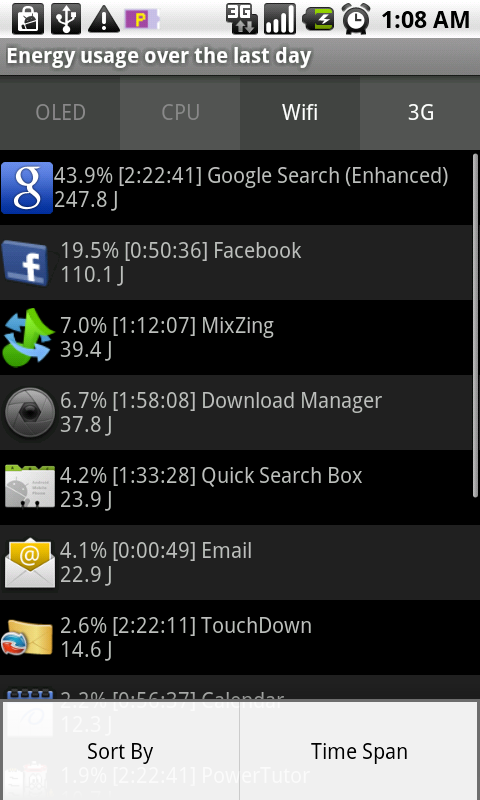
This view displays the power/energy consumption for all running applications over a certain time duration. Its major features include:
- Ranking application by hardware components: The hardware components tabs on the top include/exclude the power consumption of the specific hardware into/from the ranking of applications.
- Display detailed application power profile: By clicking on the application row, users could check out the detailed chart view and pie view of the application power consumption.
- Features from Menu:
Sort by: This adjusts the sort key for the application ranking. Users could choose from current power consumption, average power consumption and energy usage.
Time span: This adjusts the length of the time duration that is taken into account for the aggregation.
- Data interpretation:
Percentage number: The number represents the percentage of power/energy consumed by the corresponding application in total power/energy.
Time: The time field represents the time duration that the corresponding application has been monitored by PowerTutor.
Power/Energy value: This value needs to be interpreted with both the label on the top and the hardware tabs. For example, the value in the figure means the total energy usage over the day consumed by both Wifi and 3G for the corresponding application.
PowerTutor Widget
- Power consumption (instantaneous, average, from battery sensors)
- Battery lifetime
- Battery change time (if current sensor available)
- Battery current (if available)
- Battery voltage
- Battery temperature
- Percent battery charge remaining
- Absolute battery energy (in mAh)
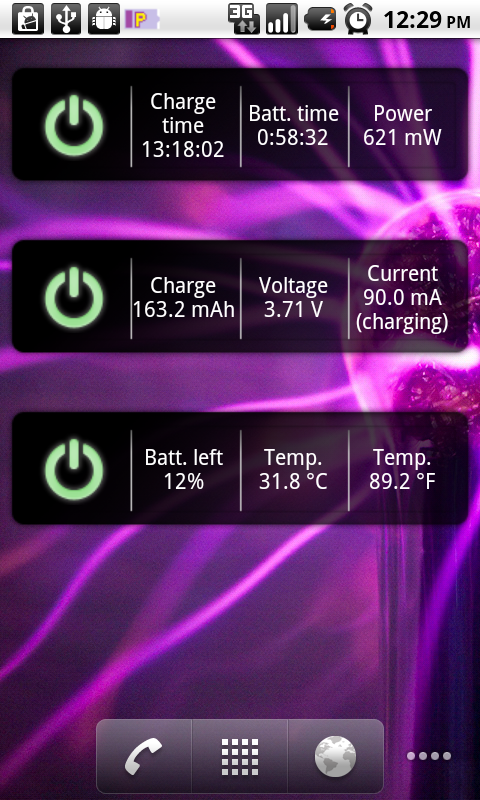
Customizable to display all of the types of information seen to the left from different sources.
Displays all of the following types of information (as seen to the left):
FAQ:
- Why does PowerTutor require root access on my Nexus one? What
happens if I don't allow root access?
This is because PowerTutor is trying to access the pixel information in Nexus one to get a better estimation of the power consumption of the screen. Nexus one is using OLED (Organic LED) screen instead of LCD screen. This makes the power consumption of the screen more sensitive to the image being displayed. Hence, to get a more accurate estimate, we access the framebuffer which gives more information of each pixel being displayed. The error for power estimation is less than 3% for OLED power estimation in this case.
If root access is not granted, PowerTutor will keep functioning without accessing the pixel information. The OLED power estimation is less accurate and the error for power estimation can be up to 20% in this case.
- What does the power trace I save mean?
We save the power trace in an easy-to-understand and concise format.
At the beginning of each saved power trace, the absolute timestamp is given after time. All samples in the trace are logged every one second and begin is used to distinguish different samples at different timestamps. The number after begin represents the elapsed time in seconds from the start of trace. Also at the beginning of the trace, a map of application name and its UID number is provided. Each individual application's power consumption is labeled with its UID in the trace. For example, associate 10023 com.google.android.youtube@1417 and CPU-10026 0 indicate that the CPU power consumption of YouTube is 0mW. The total system power consumption is logged associated with hardware component without any UID number. For example, CPU 137 represents the total CPU power consumption is 137mW.
Email: powertutor at umich dot edu
News!
Release PowerTutor source Oct. 9th, 2011
Updated Power Tutor Oct. 11th, 2010 (changelist)
Updated Power Tutor to 1.3 Oct. 9th, 2010 (changelist)
Updated Power Tutor Aug. 23rd, 2010 (changelist)
Updated Power Tutor to 1.2 Aug. 1st, 2010 (changelist)
Released Power Tutor Nov. 17th, 2009